
tutorial_1-creating_charts_and_tables
Tutorial 1 - Creating charts and tables
Page 5 of 5
In this lesson you will learn how to display simulation outputs as charts and tables. The easiest way is to create charts and tables from the Results window.
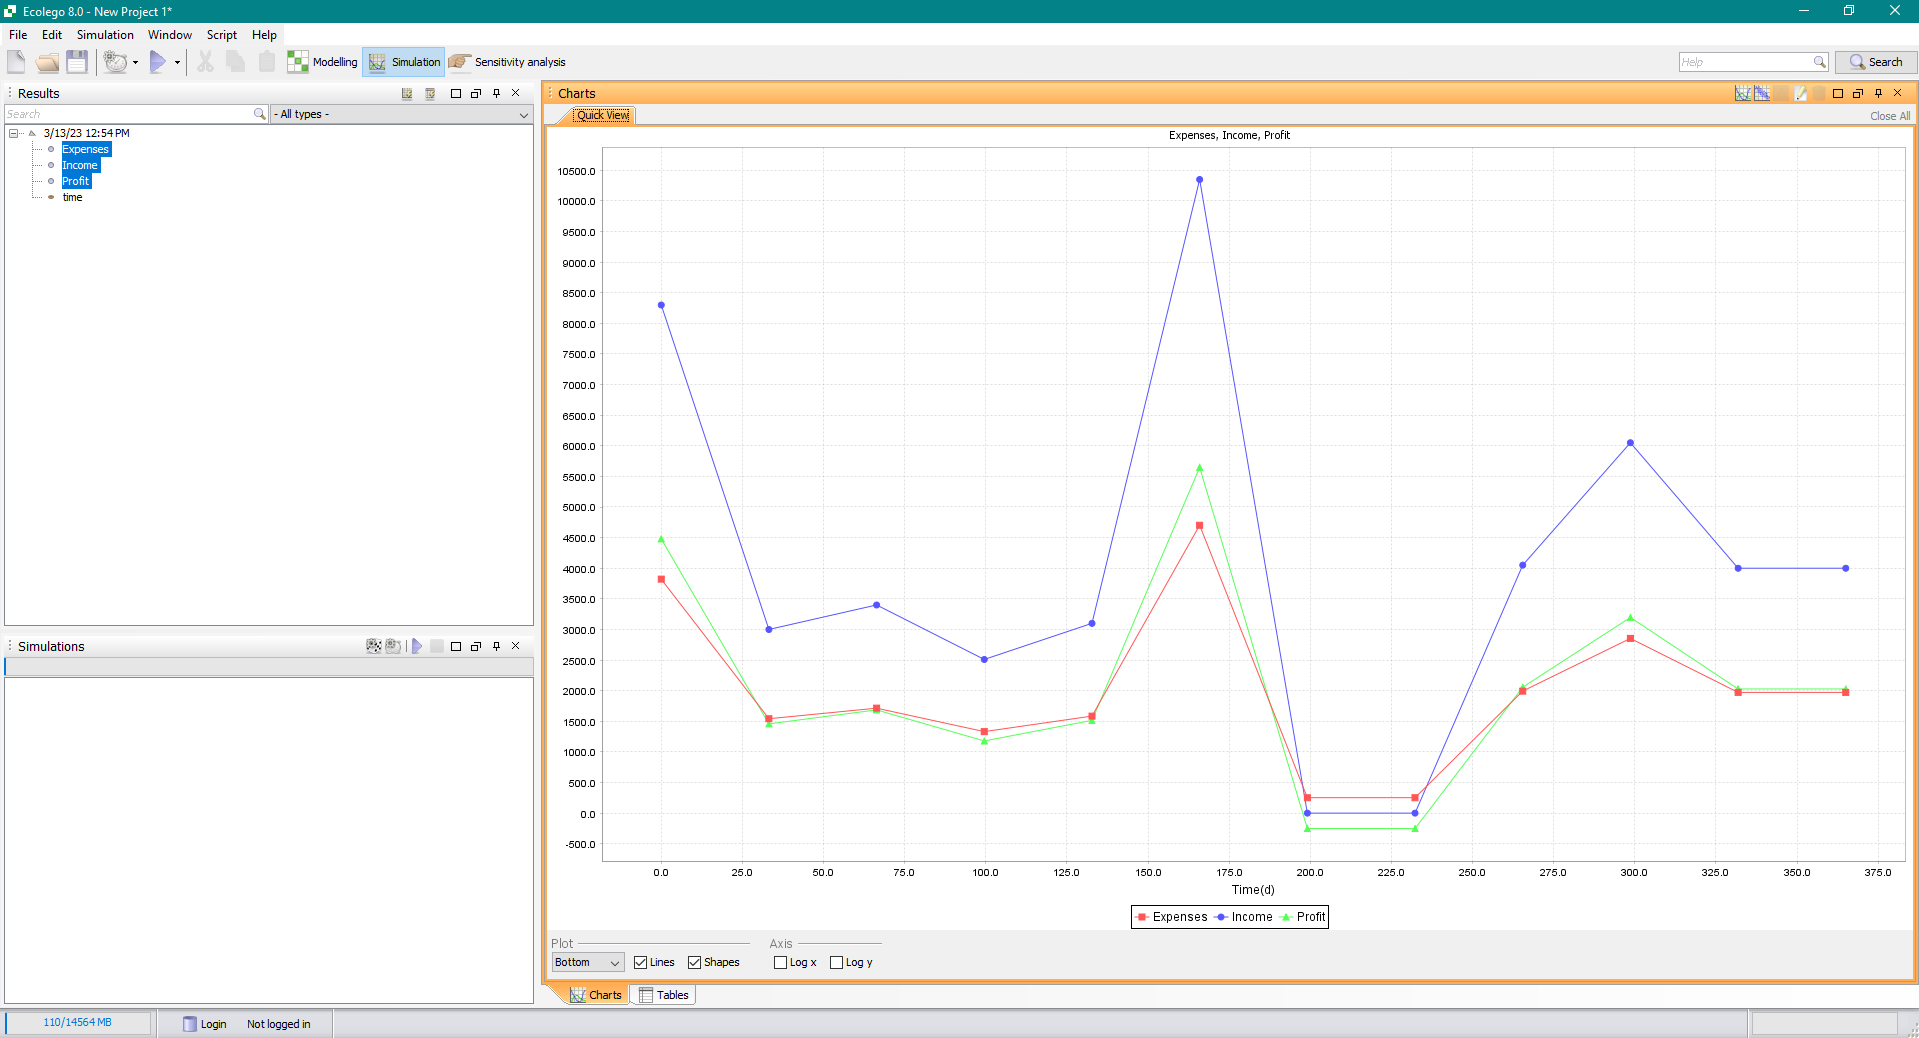
Creating charts
- Make sure that the Charts window is open by selecting Window | Charts from the Menu bar.
- Also make sure that the Results window is open by selecting Window | Results from the Menu bar.
- After running the simulation the Results window should list the output names Profit, Income, Expenses and time. Select an output to create a chart.
- To create a chart with more than one output, keep the CTRL key on your keyboard pressed while selecting outputs.
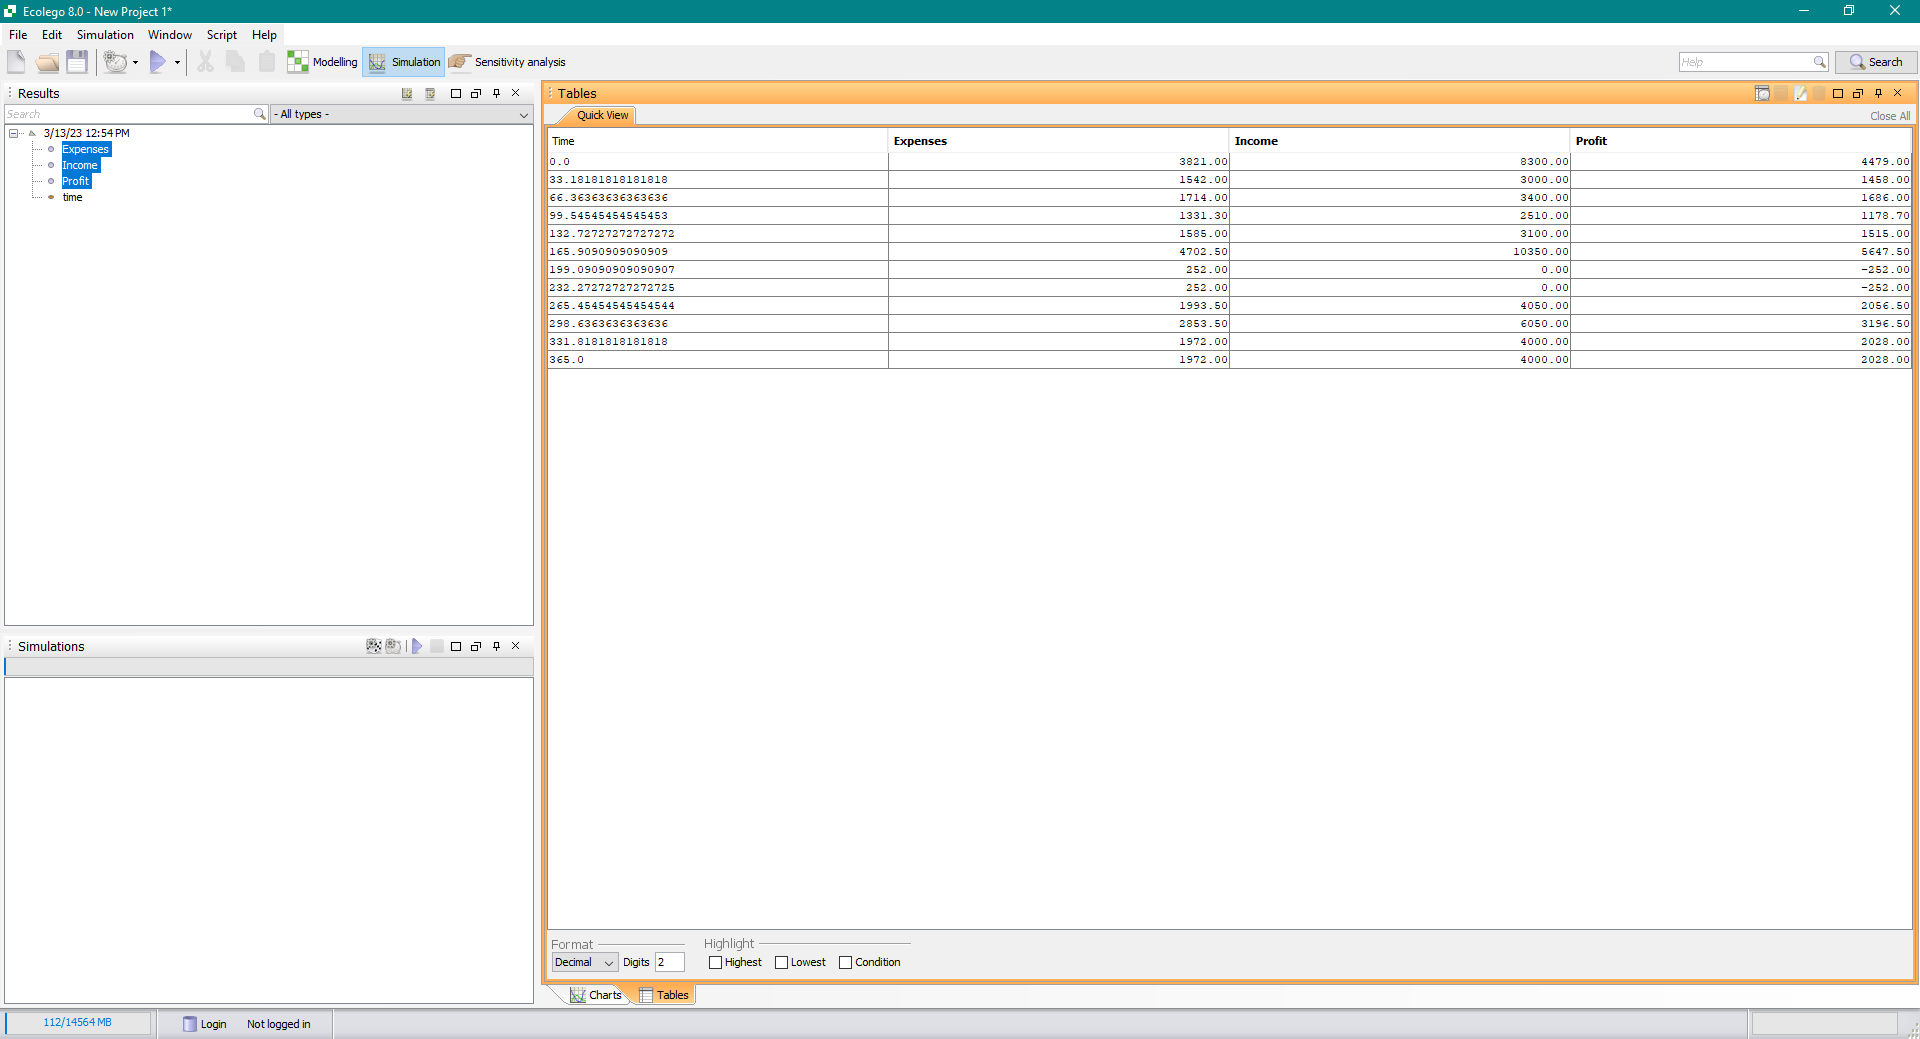
Creating tables
- Make sure that the Tables window is open by selecting Window | Tables from the Menu bar.
- Like with charts, a table is automatically created for you when you select items in the Results window.
Solution to the exercise
Previous
Reference
tutorial_1-creating_charts_and_tables.txt · Last modified: by Boris Alfonso