Tutorial 2 - Inspecting results
Page 7 of 7
In this lesson you will learn how to display simulation outputs as charts using the Results window.
Creating charts
Make sure that the Charts window is open by selecting Window | Charts from the Menu bar.
Also make sure that the Results window is open by selecting Window | Results from the Menu bar.
The Results window lists all the available simulation outputs. By clicking the Water output, a Quick view is created showing the mass of each material in water over time.
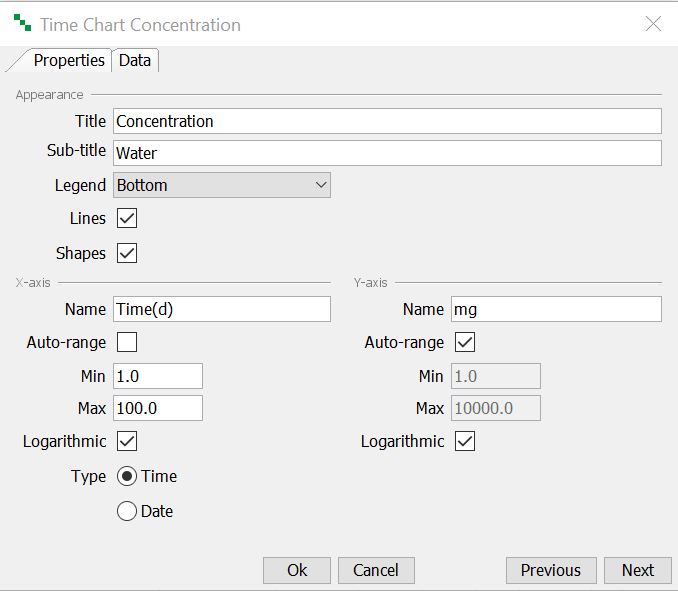
Right-click the Chart in the Charts window and select Edit from the pop-up menu. Select the Properties tab. Enter the following information:
| Title | Mass |
| Sub-title | Water |
| Legend | Bottom |
| Lines | Yes |
| Shapes | Yes |
Select the Logarithmic checkbox for both axes. For the x-axis, deselect Auto-range, set the Minimum to 1 and the Maximum to 100.
Final chart should similar to screenshot below:
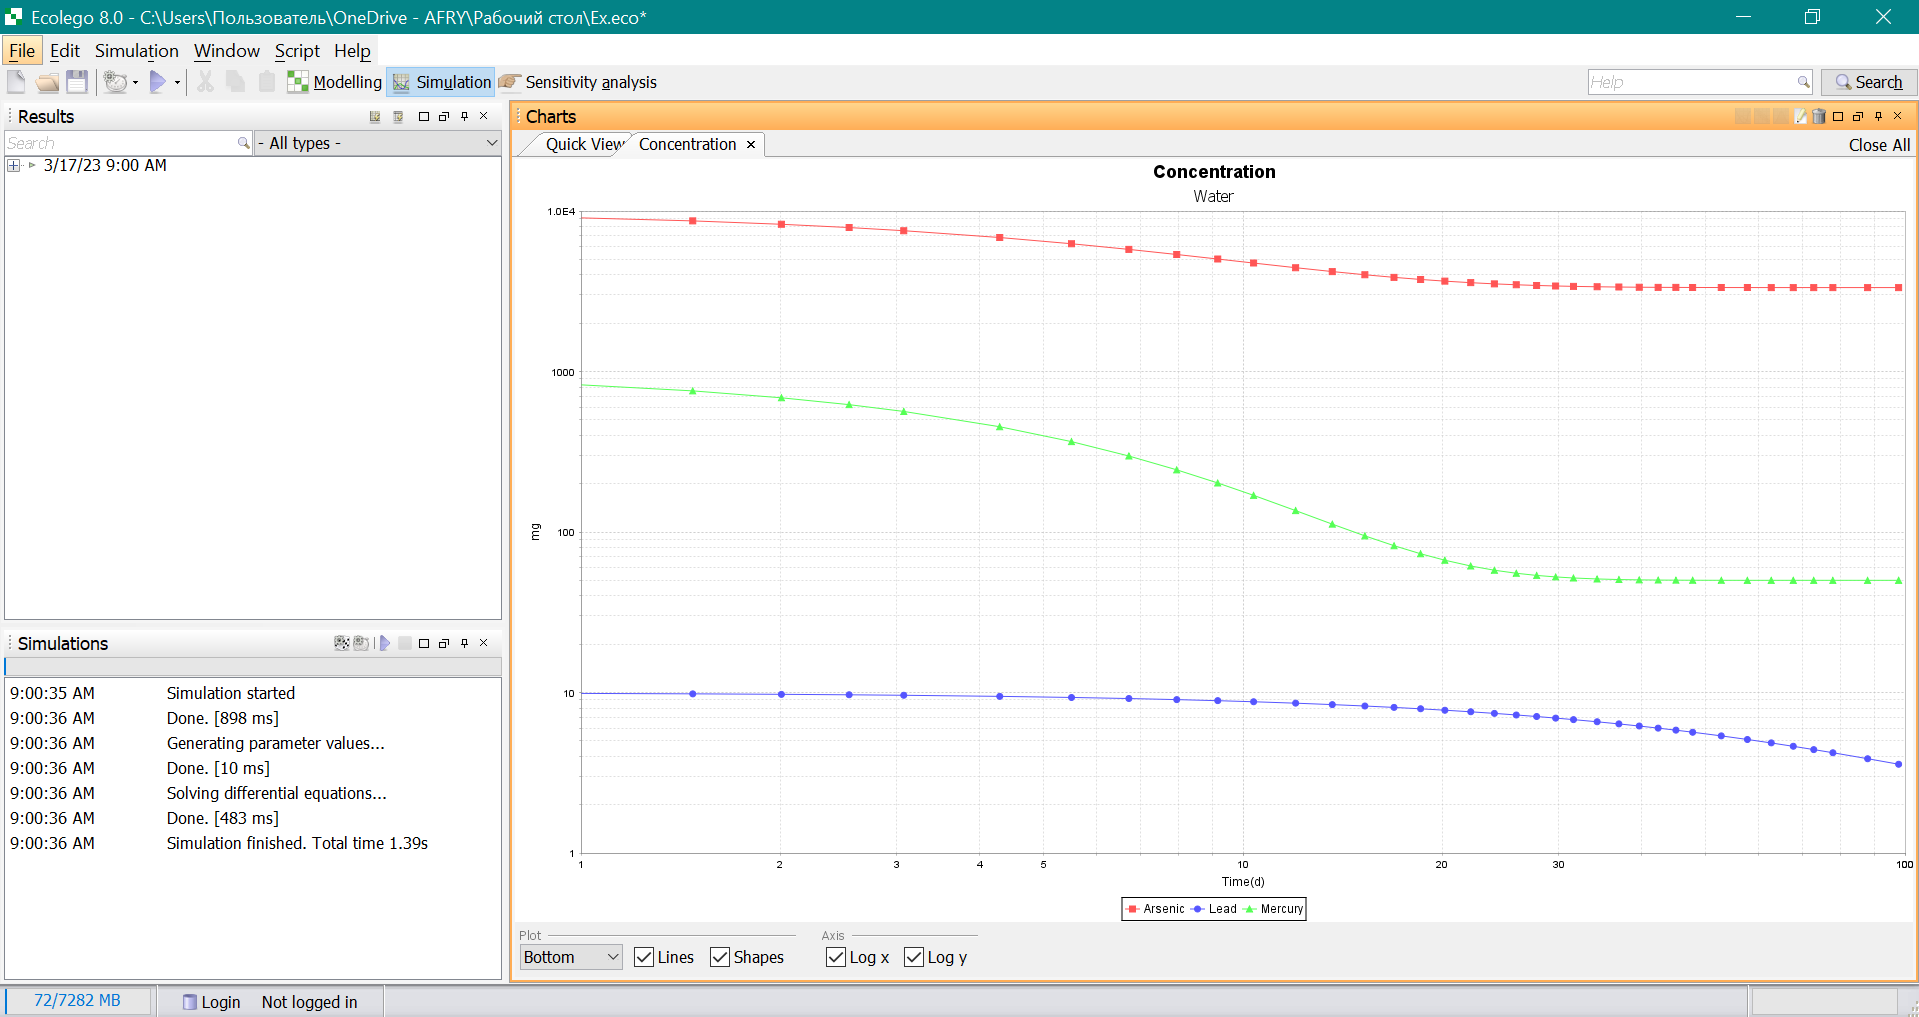
Solution to the exercise
Previous
Reference